Using machine learning techniques to predict beaching of marine debris on the Galapagos Islands
Stefanie Ypma, Mikael Kaandorp, Jen Jones, Andy Donnelly and Erik van Sebille About Us

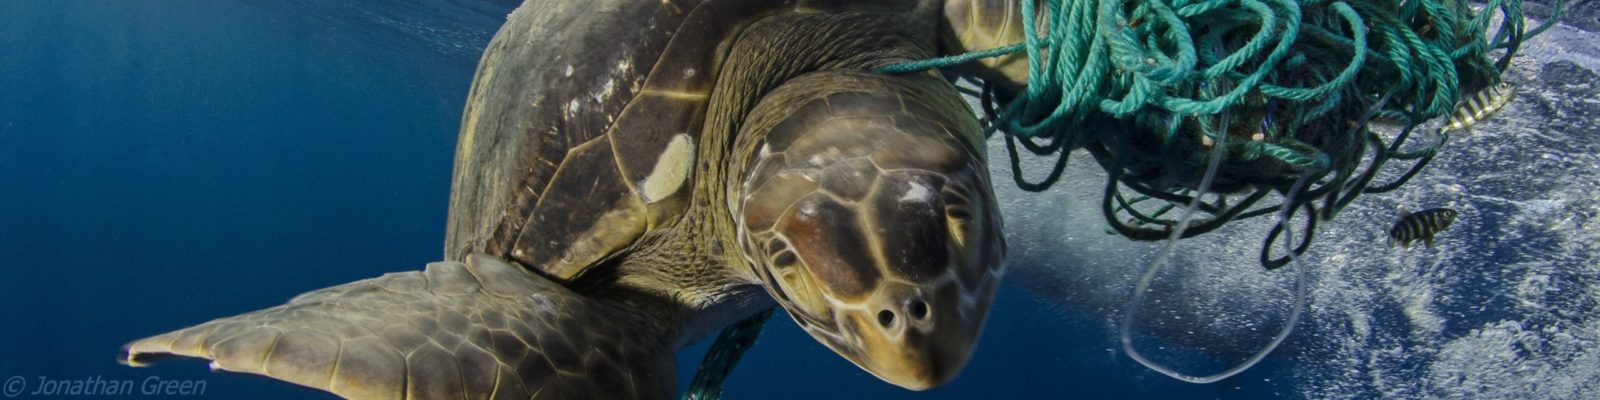
The Galapagos fur seal, an endangered species at risk for entanglement and ingestion of plastic. © Juan Pablo Munoz Perez
The Galapagos Archipelago and the Galapagos Marine Reserve host one of the world’s most unique ecosystems. Although being a UNESCO world heritage site and being isolated from any dense population, over 8 metric tons of plastic are collected on less than 1% of the islands’ coastlines each year. Sources of the plastic are likely to originate from the mainland, in particular Peru and Ecuador, and from the huge international fishing fleets often found at the border of the Exclusive Economic Zone ‘fishing the line’ while benefitting from the spillover effect. Of the rare animals found on the Galapagos, over 30 species are in need of urgent monitoring and mitigation due to the plastic pollution as identified by a systematic risk scoring analysis.
As the clean up efforts depend on the limited capacity to go out by boat and the accessibility of coastal sites, there is a need for a tool that predicts where and when plastic washes ashore. This way, clean up efforts can be optimised to target locations that are easily accessible, with high fluxes of plastic beaching and where the plastic pollution is causing most harm to marine and terrestrial species.
Fig.1 Beached plastic forecasting
As a first step we need a forecast that is able to capture the spatial and temporal variability of beaching events as shown in this animation. As the observational database of the plastic distribution on the Galapagos Islands is still scarce, different machine learning techniques are applied to a Lagrangian particle simulation using ocean-, wave- and tide-models.
Hydrodynamic fields
- Surface and Merged Ocean Currents (SMOC)
- Hourly mean fields of surface Eulerian velocity, tidal velocity and Stokes Drift
Particle simulation
- Lagrangian framework OceanParcels
- Daily release of particles along the Exclusive Economic Zone (see introduction)
- Particles are advected for four years
The green dots in the animation show all virtual particles that get stuck on one of the Galapagos Islands and are therefore classified as beached (read more about beaching parameterisations).
Fig.2 Temporal beaching variability
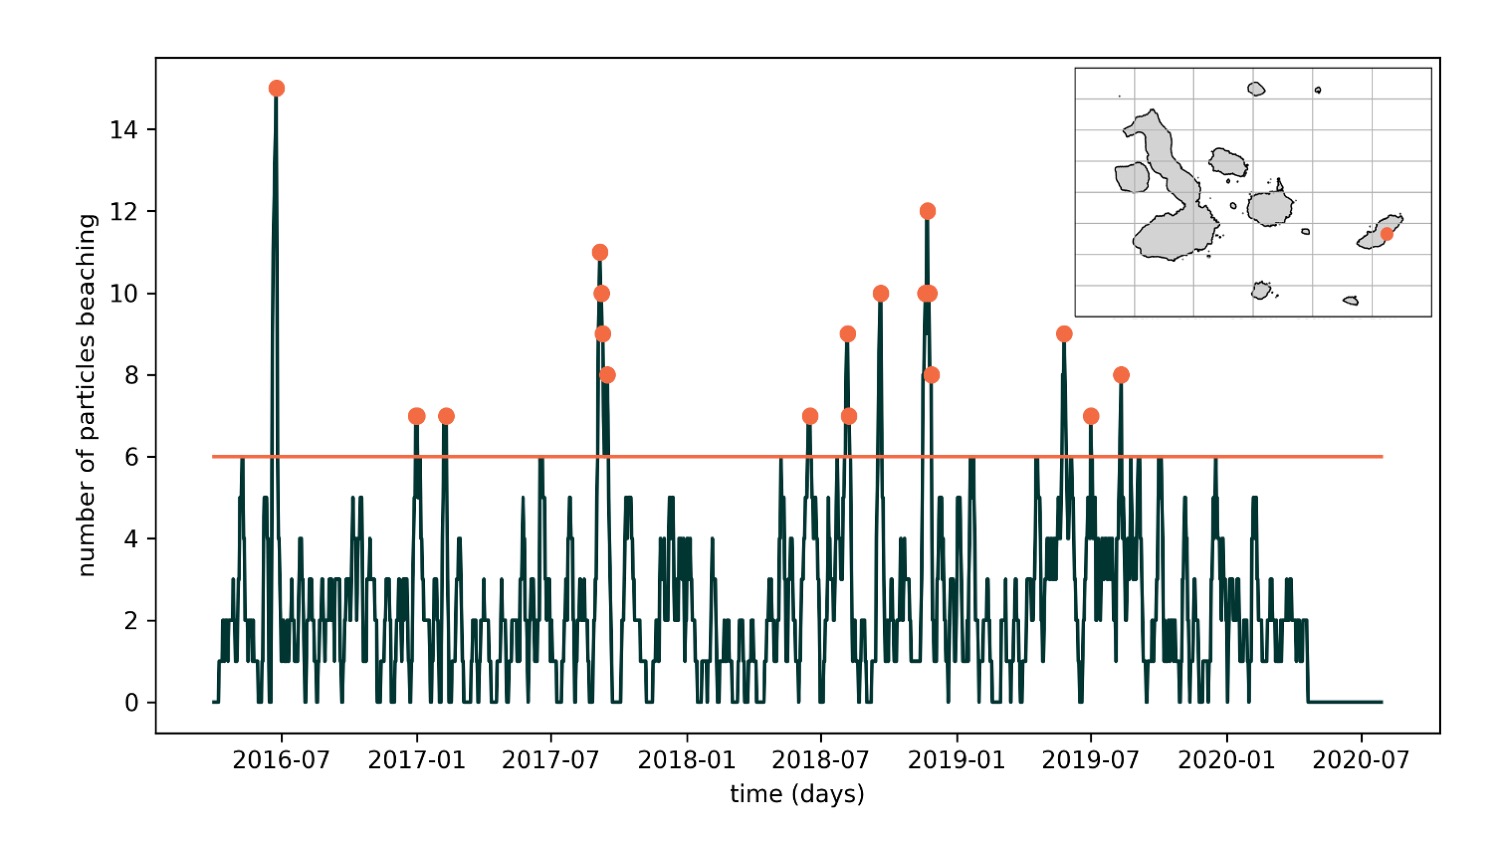
Using the particle simulation, we can derive a time series (green line) of the number of particles beaching at every coastal location (defined by the resolution of the ocean model used, see inlay).
The orange dots indicate peak events (>95 percentile, horizontal orange line), where a high number of virtual particles wash ashore. These peak events are used to identify beaching clusters that show similarity in temporal and spatial beaching variability.
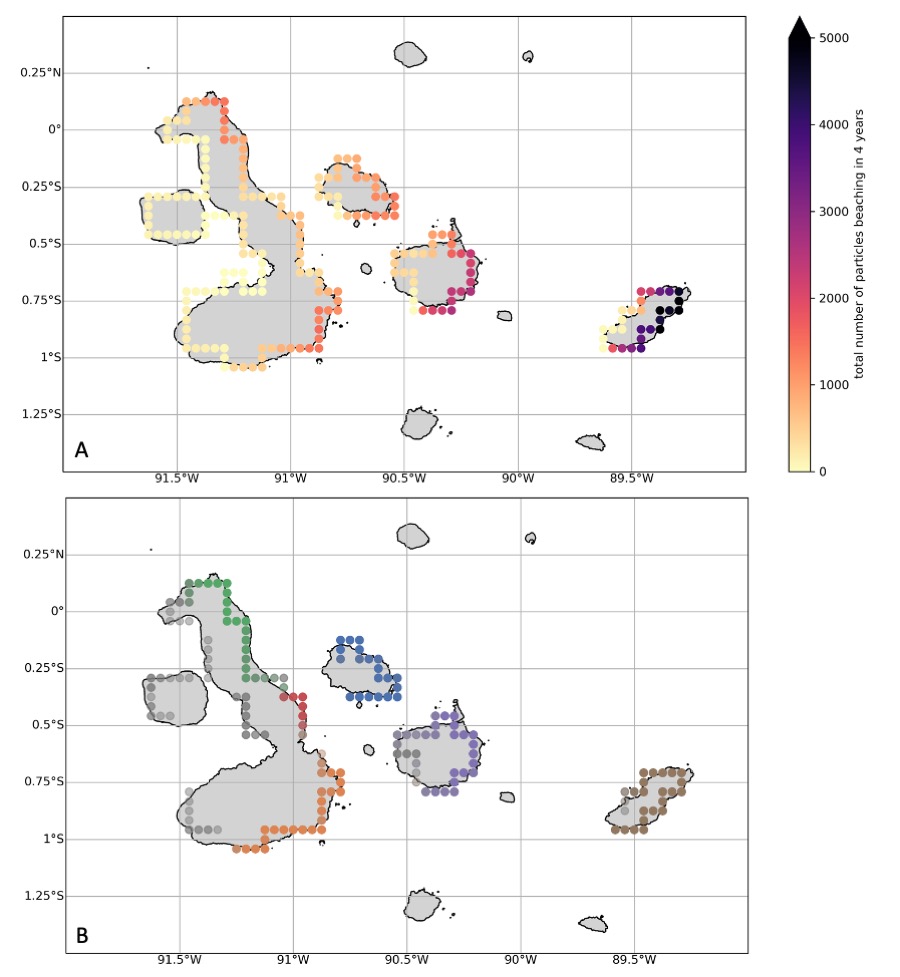 Fig.3 Spatial beaching variability
A. As the dominant ocean flow is westward, most particles beach at the eastern side of the islands. In addition, we observe some sort of ‘wake effect’, also evident from the particle simulation, as there are more particles beaching on the most eastern located islands than on the islands located more towards the west.
B. Based on the height of the peak events of Fig.2 and the locations where particles beach, we can define clusters (using a hdbscan). These clusters of peak events are used to construct velocity anomalies from which we can determine useful environmental parameters for the forecast.
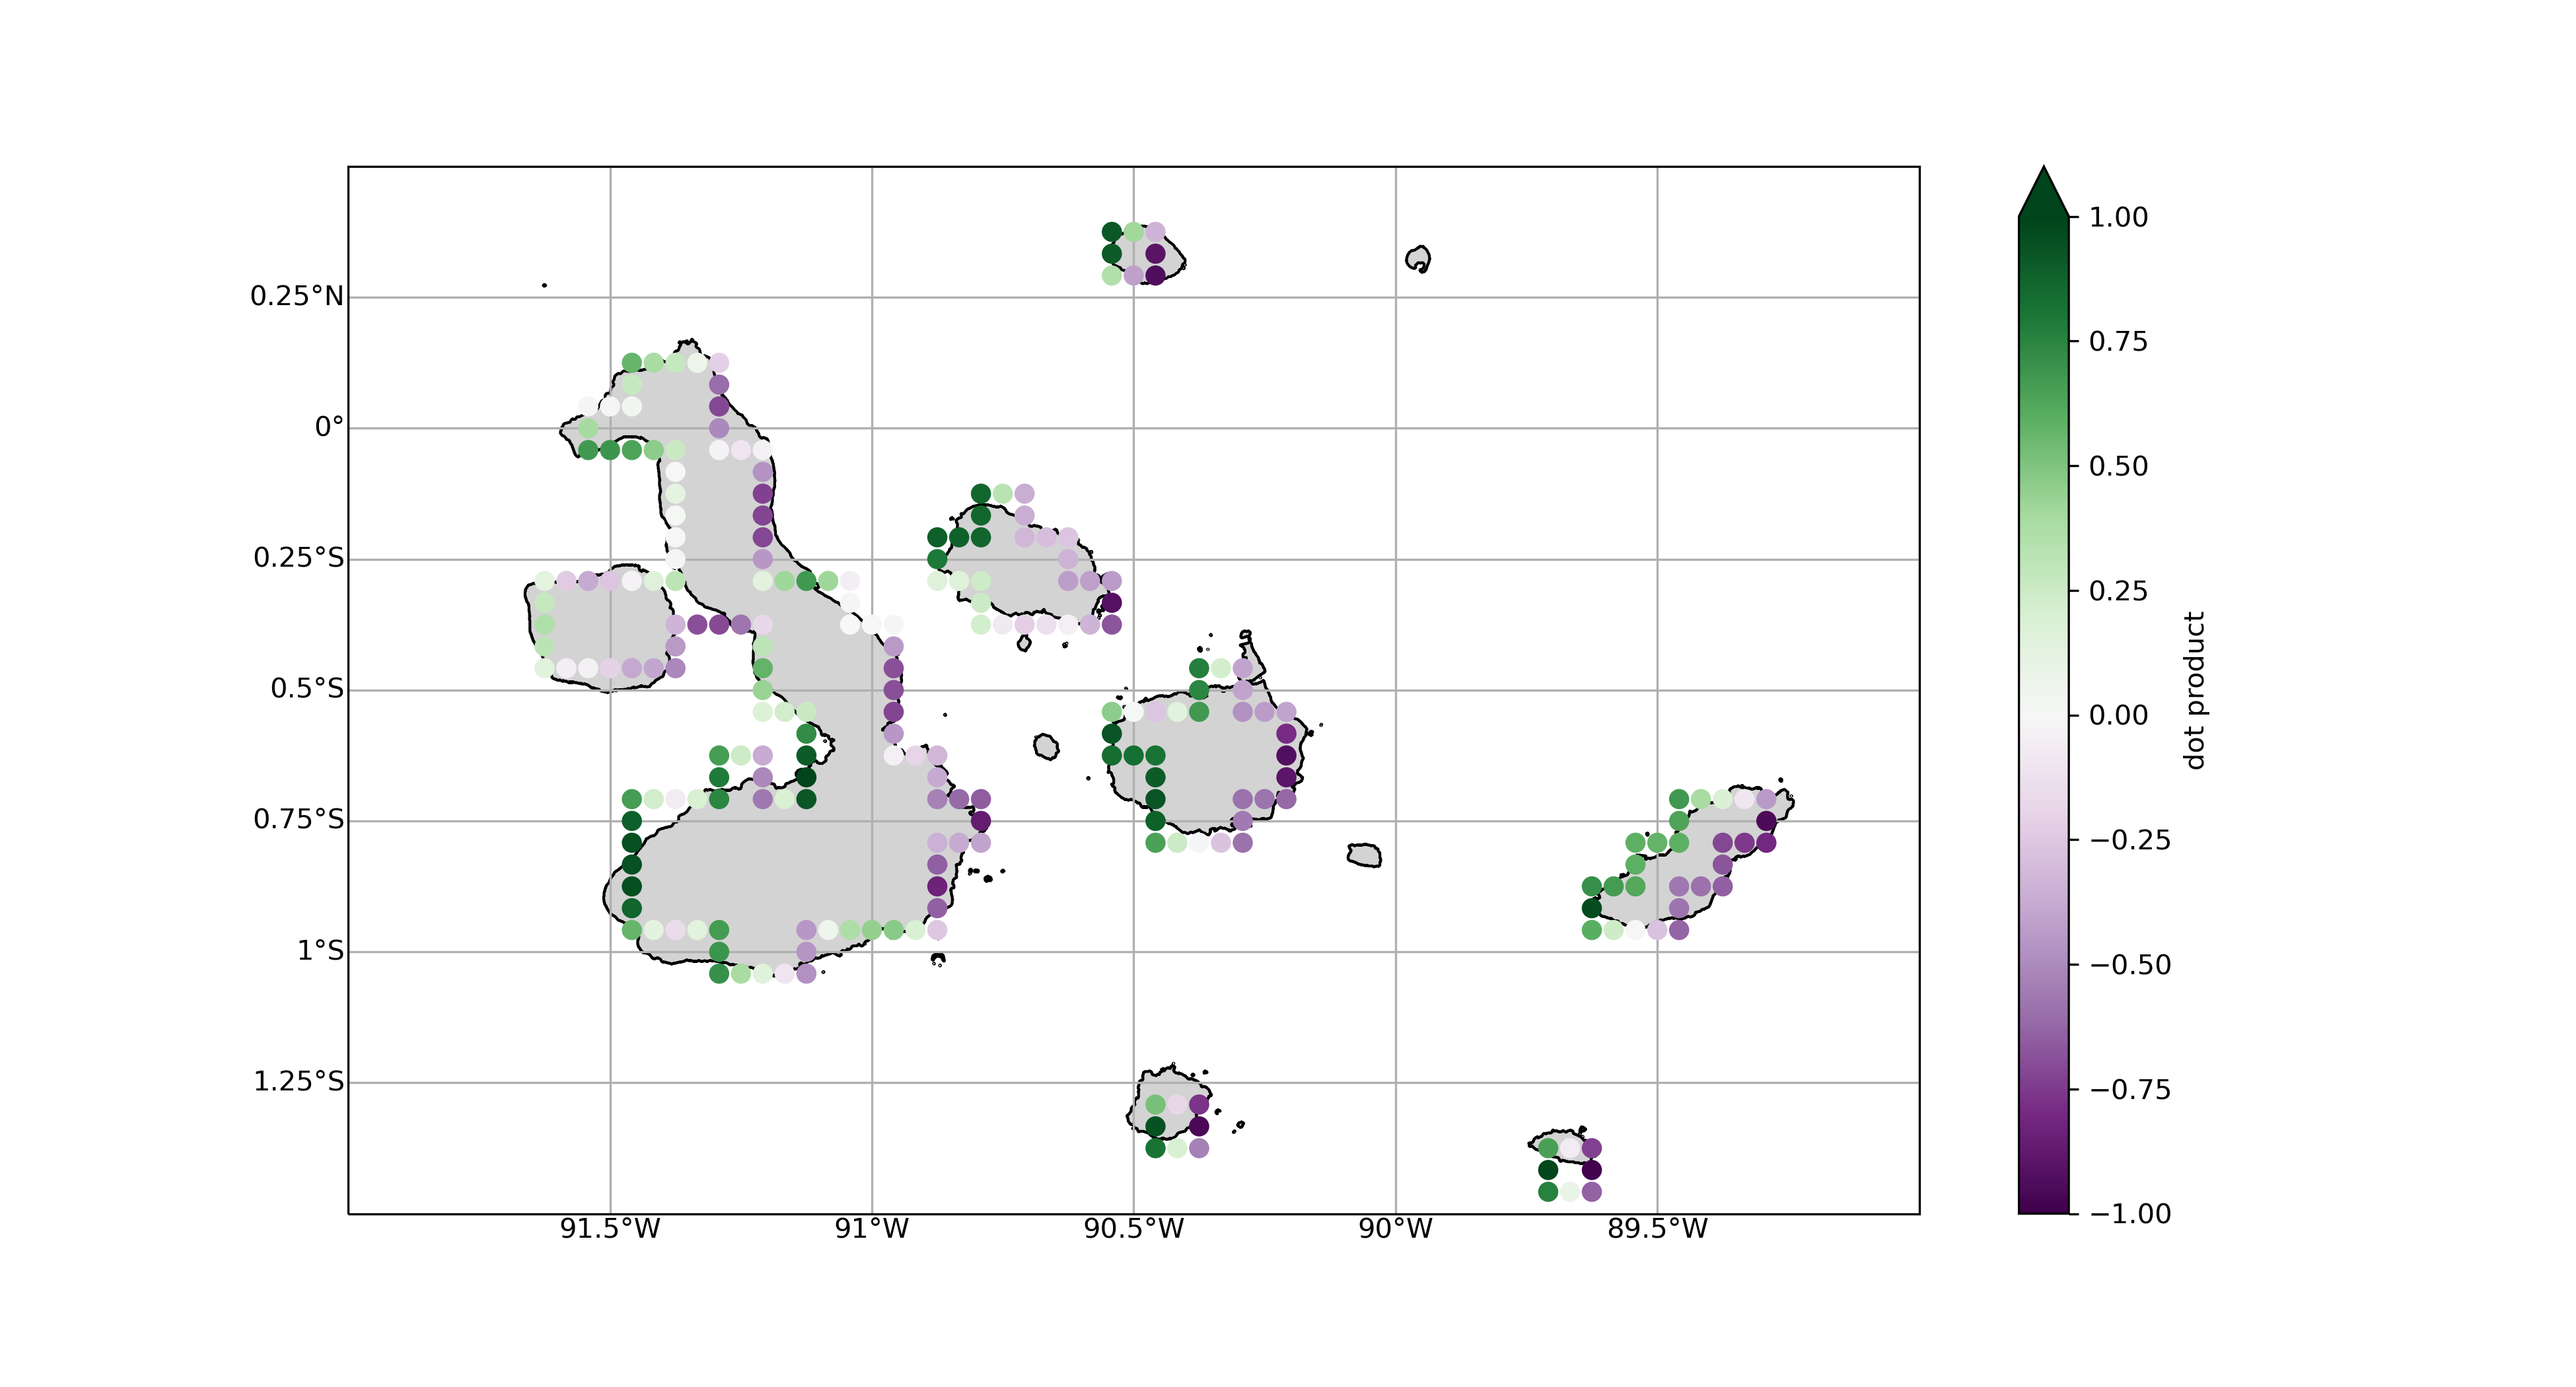
Fig.4 Dot product of the local 4yr mean Eulerian velocity field with the normal of the coastline. Negative values indicate flow towards the coast, positive values indicate flow away from the coast.
Possible parameters are:
- Mean magnitude of the (Eulerian, tidal, Stokes Drift) velocity field at the beaching location
- The direction of the mean velocity field at the beaching location, represented by the dot product of the direction of the flow and the normal of the local coastline (Fig.4)
- Hot spots in the velocity fields derived from the cluster analysis (Fig.5)
- A shielding parameter indicating at each beaching location to what extent the mean flow is blocked by other islands
- The day number to incorporate any seasonality
Fig.5 Velocity anomaly at peak events
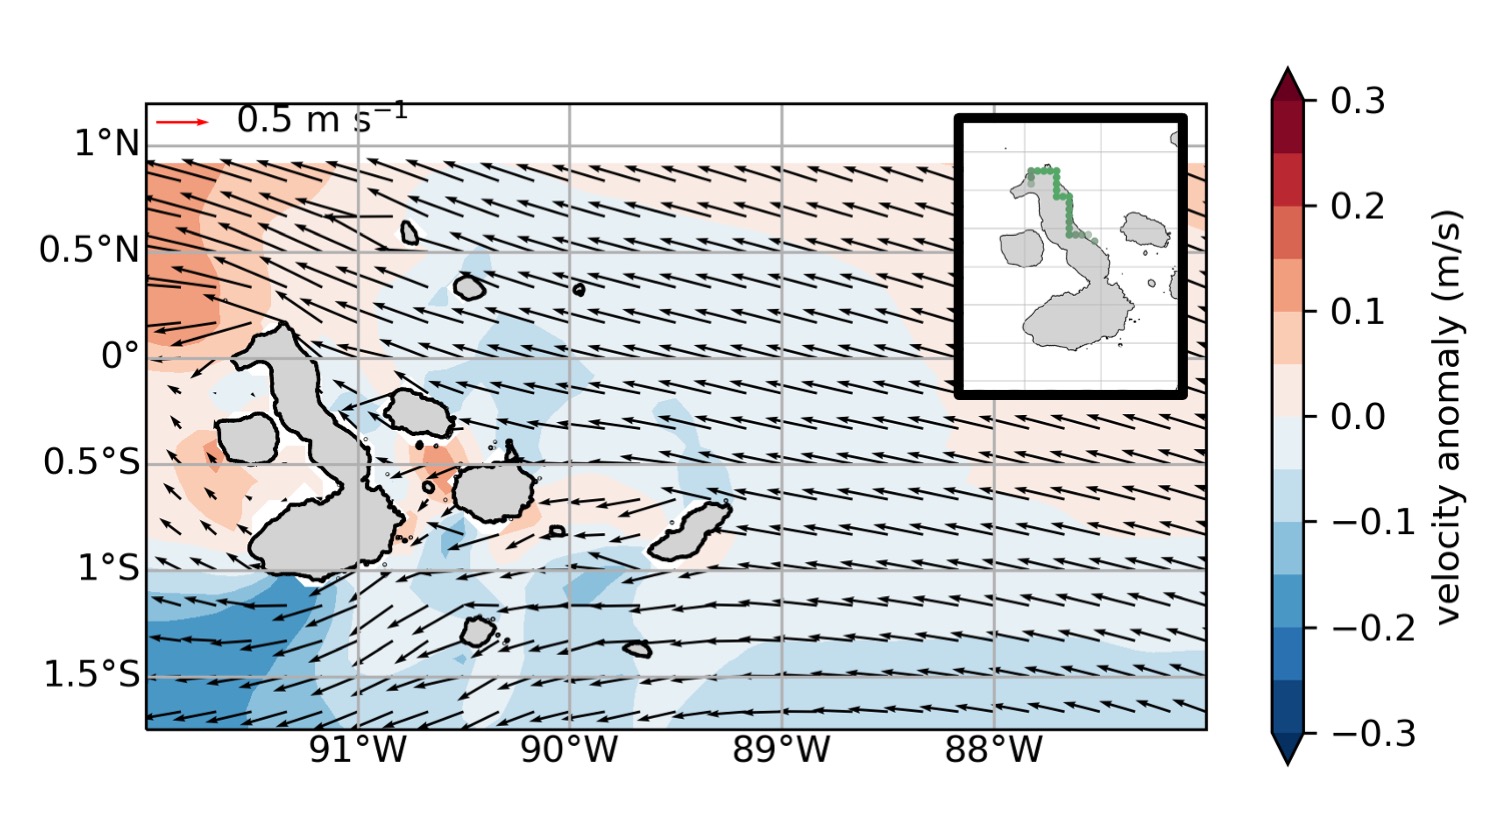 The velocity fields related to the different peak events of the various clusters are compared to the 4yr-mean velocity field. In case of the beaching events at the northern tip of Isabela Island, the total velocity field is much stronger north of the island compared to the flow field in the south. Therefore, the magnitude of the velocity at these locations, or the difference between the northern and southern velocity field are useful environmental parameters for the forecast of beaching events.
Fig.6 Linear Regression vs. Random Forest Regression
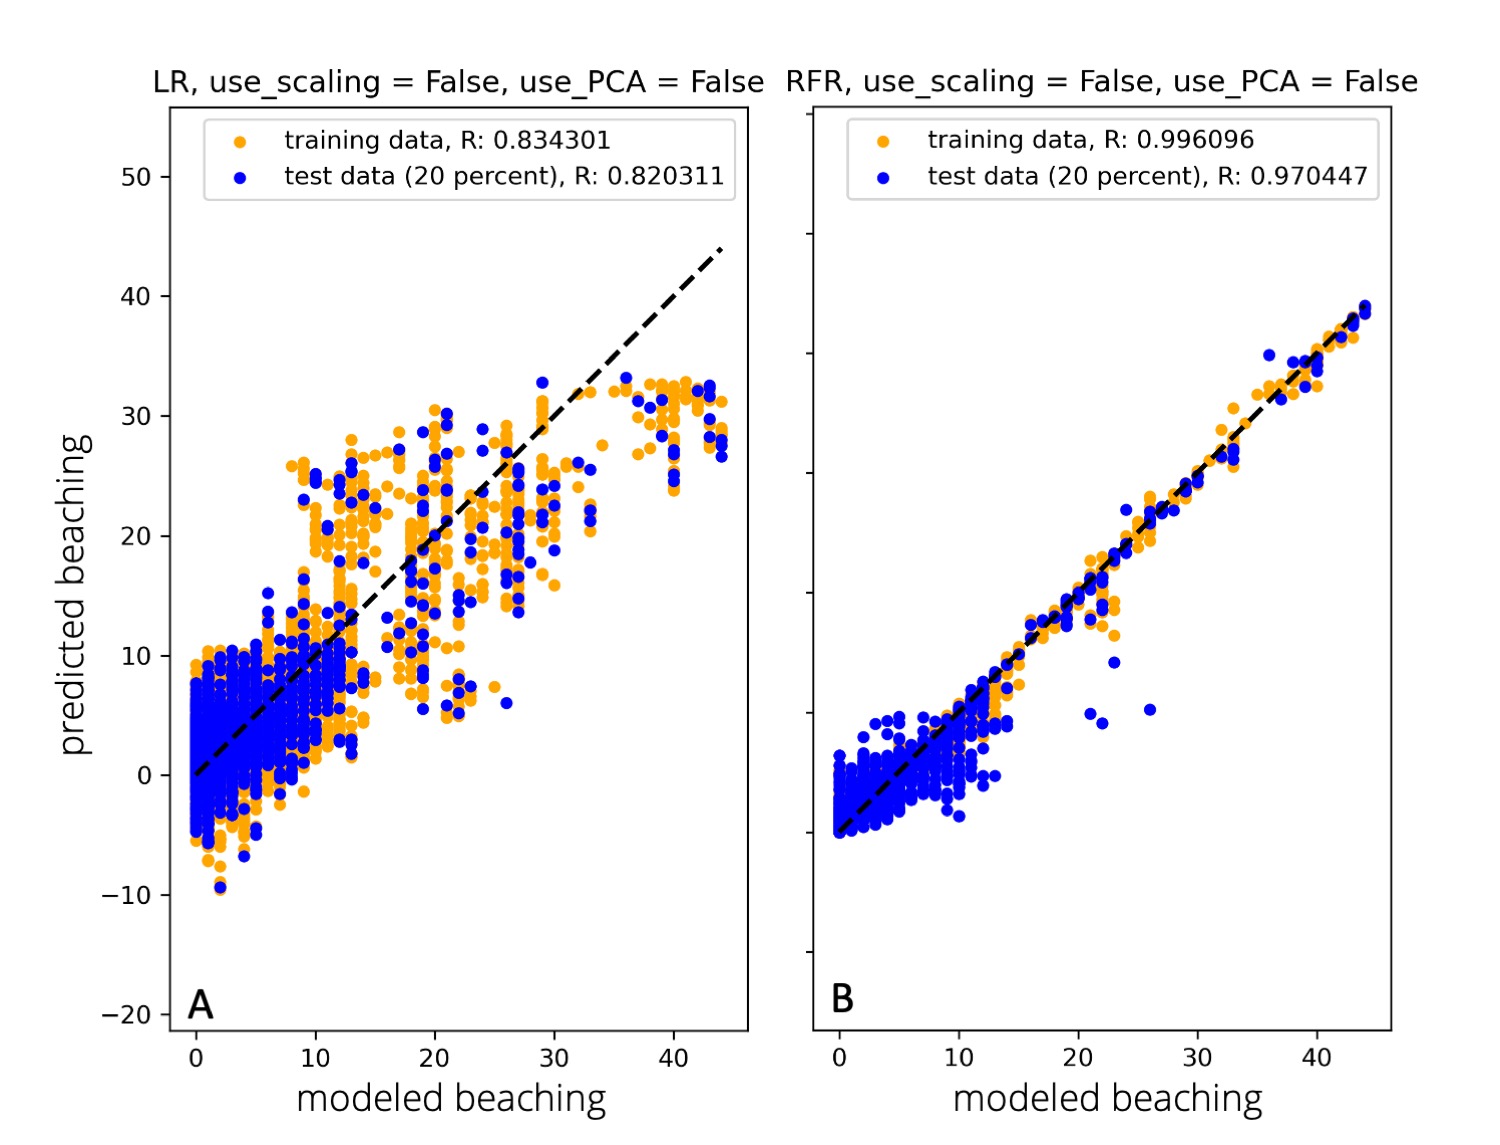 The beaching time series simulated by our particle model and the environmental parameters discussed in the previous section are used for a Linear Regression and a Random Forest Regression. Using only the local mean magnitude of the different velocity fields, the Random Forest Regressions has a better skill at predicting the number of particles beaching compared to the Linear Regression. The other environmental parameters still need to be implemented to also assess the predictive skill of the Random Forest Regression.
Please leave a comment if you know of any other machine learning techniques that would be applicable in our study or if you have any suggestions on our methods used so far. We greatly value your input!
Validate and improve our modeled beaching time series
- Improve the beaching parameterisation using the results from our drifter field campaign (planned for Summer 2021)
- Compare our time series to the distribution of plastic on the Galapagos Islands
- Connect our particle simulation to the variability in pollution sources from the fishing industry and from the mainland
Continue to extend the environmental parameters to improve the forecast
Machine learning applied to observations
- Due to the limited observational database on the Galapagos Islands it has so far not been possible to use this data for the machine learning. However, yearly observations along the Dutch coast served as a useful test case for the machine learning method presented here and this technique has been successful in explaining the beaching variability seen along the Dutch coast.
Other work
- We are currently also working on understanding the connectivity between the different islands to find optimum locations for clean up, incorporating the impact on wildlife and the accessibility of different locations.
- If you are interested in the legal framework related to plastic pollution near the Galapagos Islands, take a look at one of our blog posts.
Feel free to leave a comment if you have any remarks, questions or are interested in any of the data and scripts.